Performance
Vistafolio analyses, monitors and operates a model portfolio where the Partners' own money is invested. We apply this to client accounts in accordance with their risk profile and trading preferences.
The strategy is to invest in quality, undervalued assets in developed markets around the world. We believe in investing in companies and sectors that improve the world and are poised for growth due to market timing, economic trends or events.

Composite portfolio investment returns as at 1 May 2023
| Jan | Feb | Mar | Apr | May | Jun | Jul | Aug | Sep | Oct | Nov | Dec | YTD | Inception | ||
|---|---|---|---|---|---|---|---|---|---|---|---|---|---|---|---|
| 2018 | -1.86% | -1.51% | 0.90% | 3.94% | 0.44% | 1.16% | 0.75% | 0.06% | 1.97% | -3.09% | -0.43% | -0.15% | 2.17% | 2.17 | |
| 2019 | 5.34% | 4.00% | 3.74% | 2.84% | -0.44% | 2.44% | 0.45% | 1.18% | 3.89% | 1.78% | -0.62% | -0.19% | 24.41% | 26.58% | |
| 2020 | 2.82% | -7.70% | -23.95% | 10.04% | 3.46% | -0.85% | 0.91% | 4.28% | 0.39% | 0.07% | 9.78% | 6.11% | 5.36% | 31.94% | |
| 2021 | 0.01% | 1.52% | 6.96% | 2.57% | 3.33% | 0.23% | -1.58% | -0.53% | -1.38% | -1.42% | 0.71% | 8.06% | 18.47% | 50.41% | |
| 2022 | 1.66% | 1.11% | -0.59% | 1.51% | -2.20% | -6.86% | 6.00% | -3.48% | -6.96% | 6.14% | 3.38% | -2.55% | -2.84% | 47.57% | |
| 2023 | 6.73% | 0.36% | -3.71% | 4.47% | Update | 7.85% | 55.42% | ||||||||
|
*This shows the returns that have been generated by this investment strategy in the past. Annualised returns are after applicable fees (where fees are charged) and exclude local taxes. Your actual portfolio will differ from the portfolio that generated these returns and fees may vary. Important: it does not tell you how the investment strategy will perform in the future.
Update 15 May 2023: Vistafolio Managed Accounts rebranded to Wealth Morning Managed Accounts. Please click here for the latest performance chart.
|
|||||||||||||||
Model portfolio details:
Focus: Capital preservation, income and growth over 5 years.
Key Markets: UK/Europe, North America, Singapore, Australasia.
Standard Deviation: 3.43% (volatility measure)
Sharpe Ratio: 3.04 (return to risk ratio)
Outperformance of Index: 100.18% (since inception, 2014-2022)
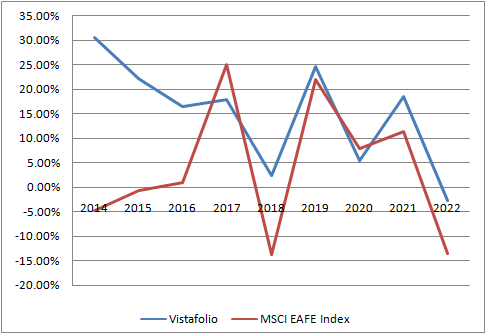
Annualised returns on our model portfolio v. the MSCI EAFE Index.